Case Study
Streamlining an Internal Maintenance Dashboard
Project Overview
The Product
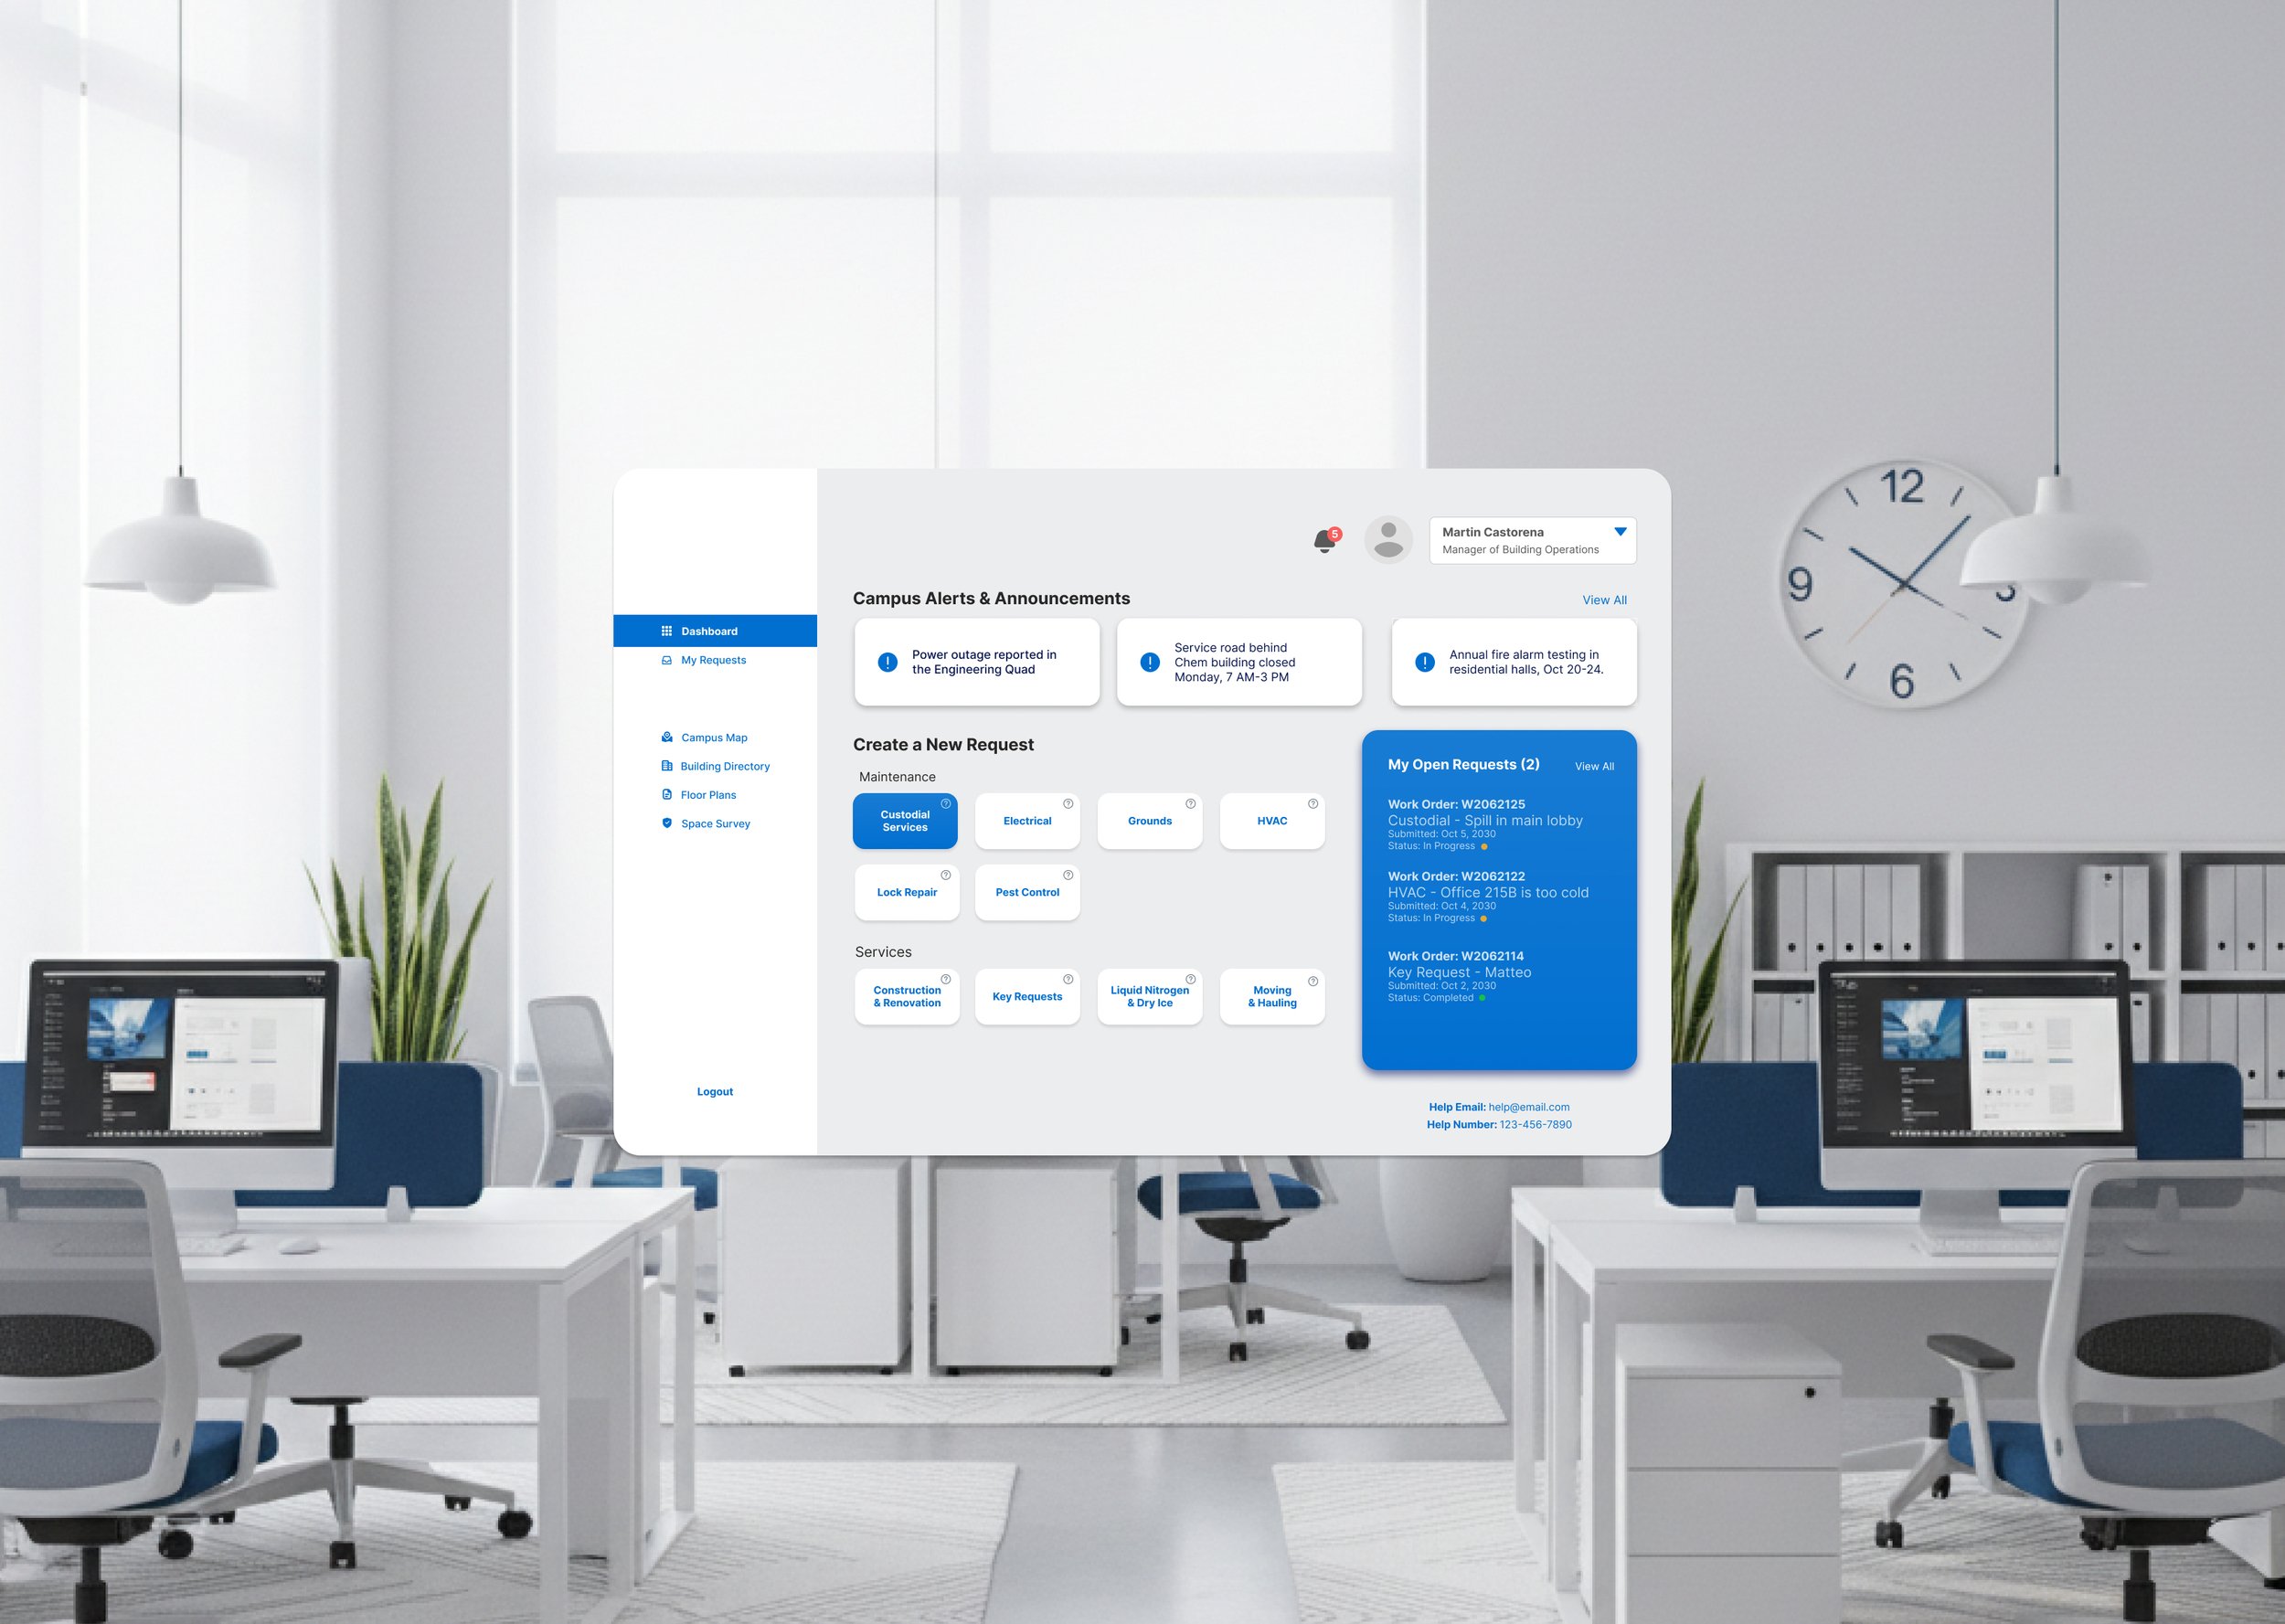
An internal dashboard used by employees to report maintenance and facility requests.
My Role
UX Designer, UX Researcher
The Problem
The existing dashboard contained several points of friction that made a necessary "chore" task more time-consuming and confusing than it needed to be.
The Solution
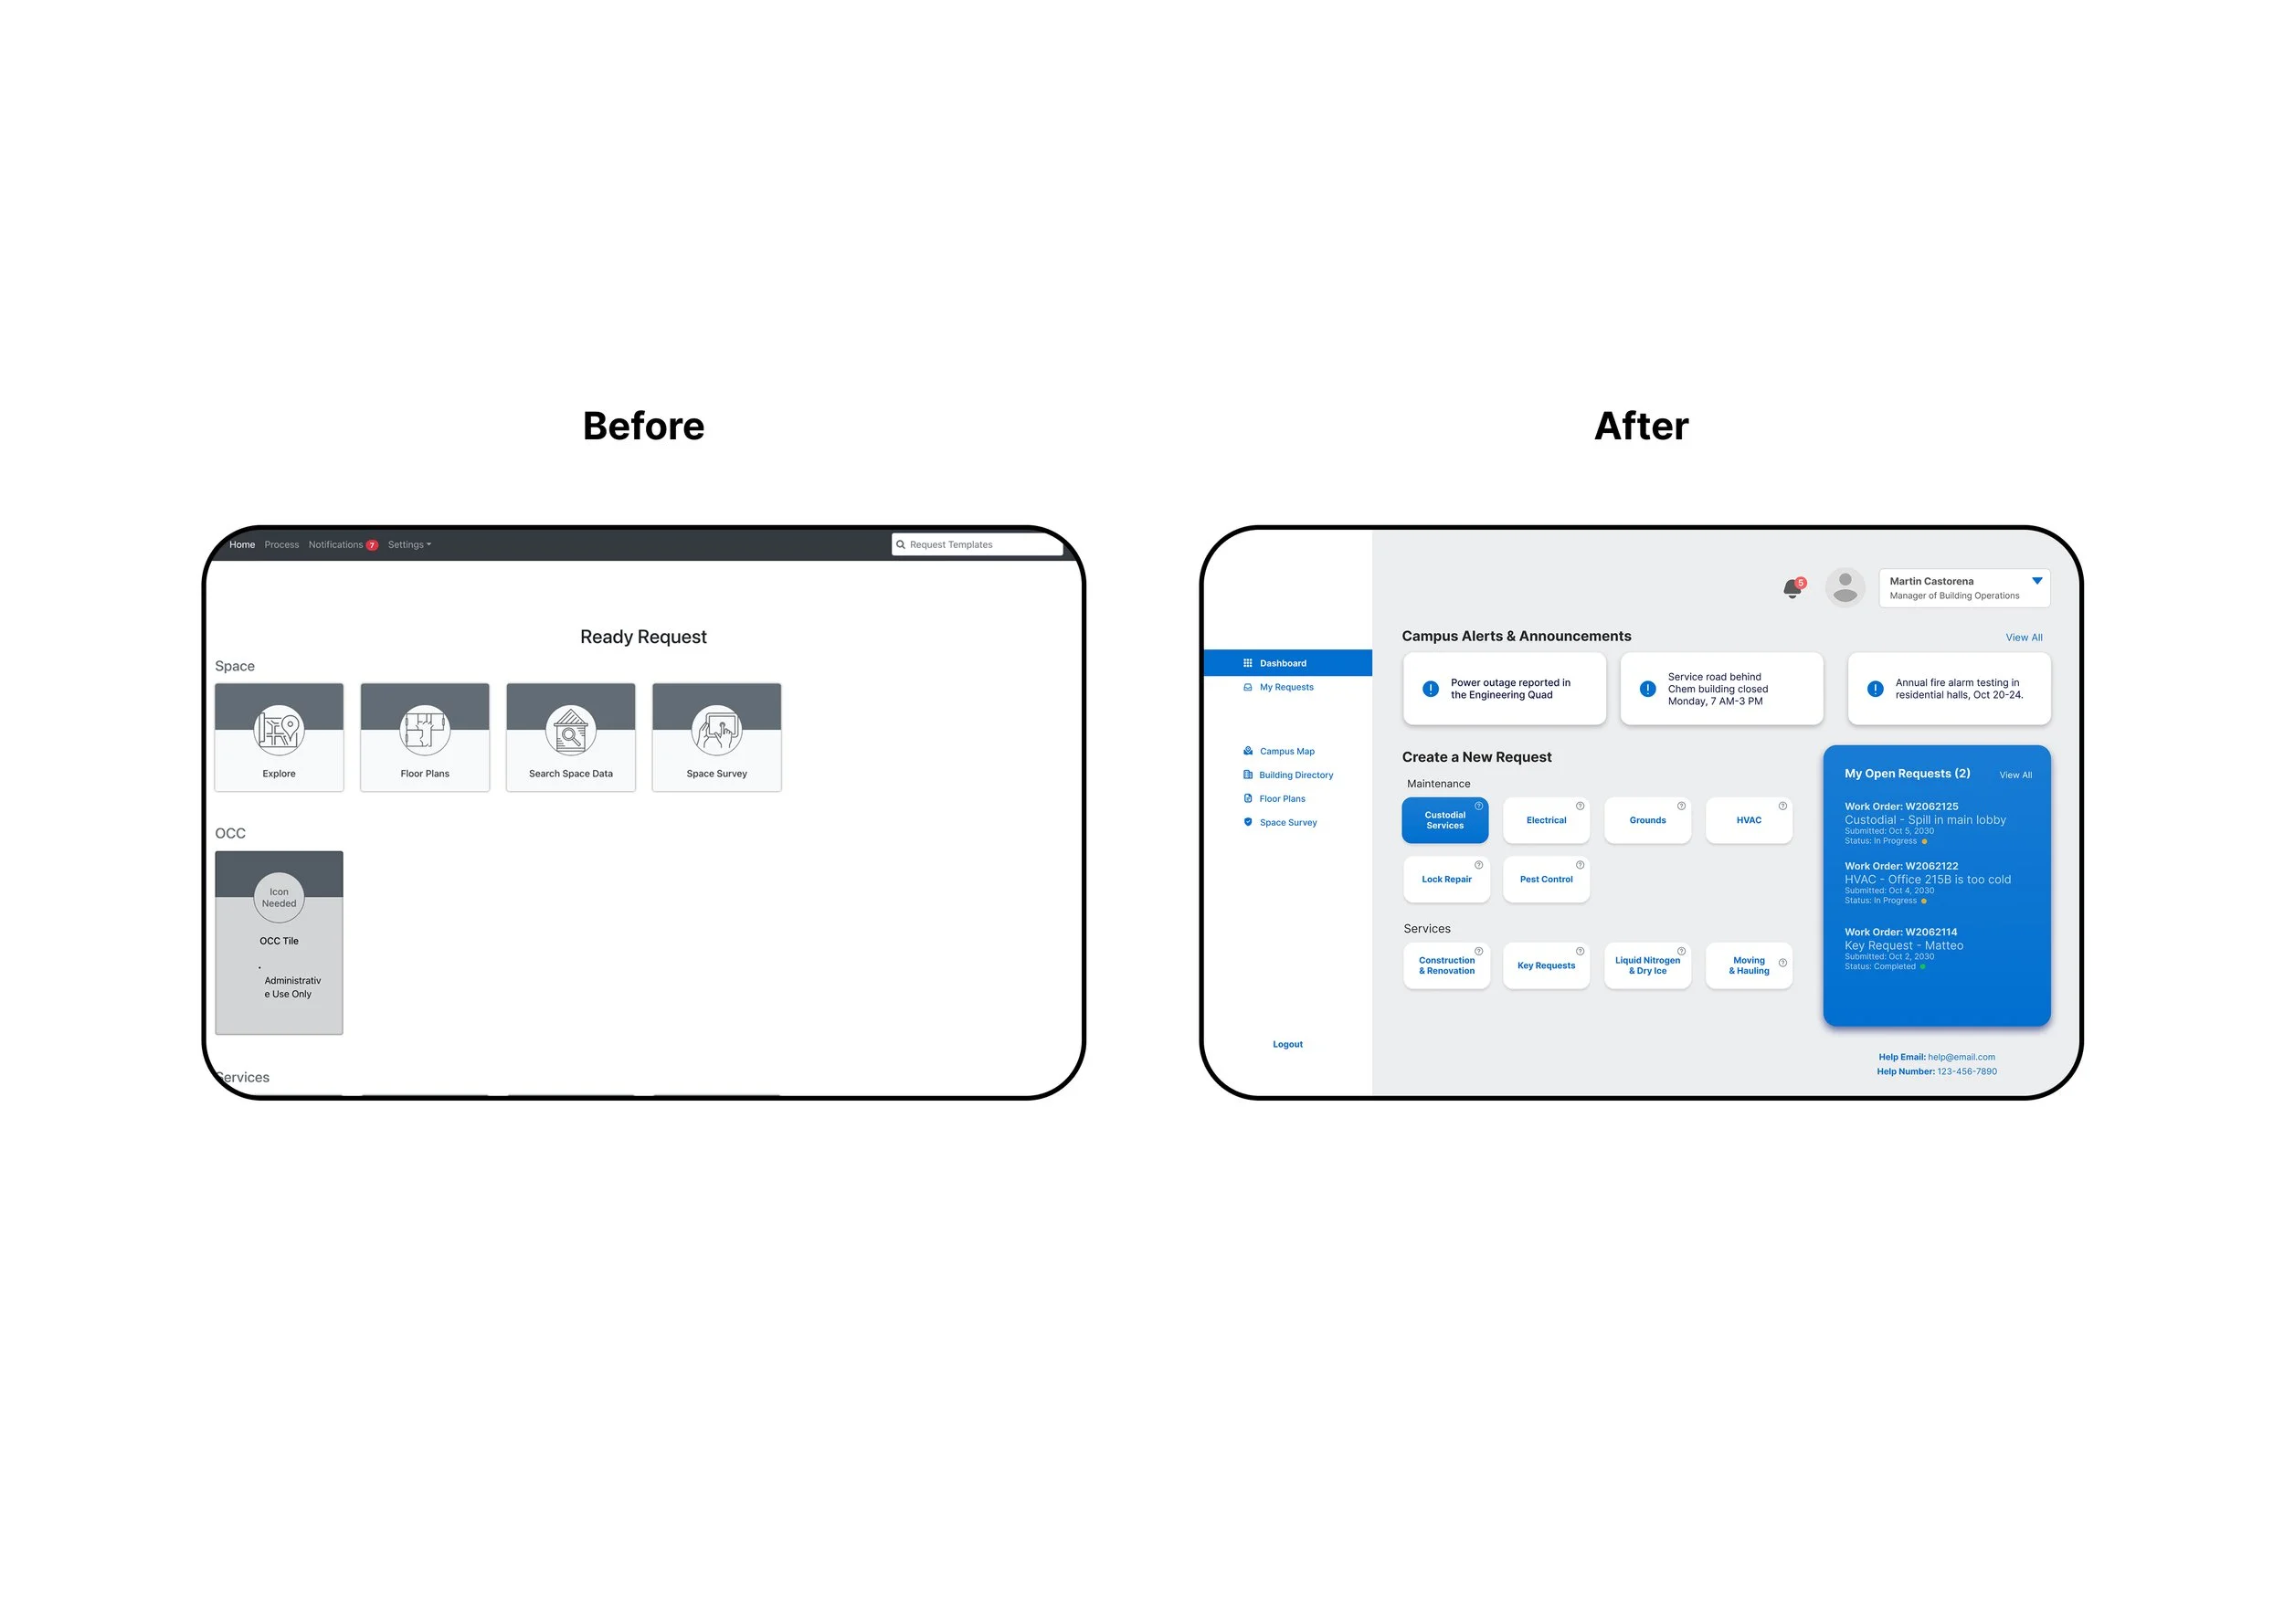
A streamlined redesign focused on clarifying user paths and removing friction. The new interface is designed to reduce cognitive load, save employees time, and minimize frustration.
The Goal
Using a heuristic evaluation, identify key usability issues and propose targeted, high-impact design solutions to create a more efficient and intuitive experience.
Validation Strategy
A comprehensive testing plan was developed to measure success through qualitative usability tests and key quantitative metrics, including Time on Task and the System Usability Scale (SUS).
My Process at a Glance
My process wasn't just about making things look better; it was about making them work better. I followed a structured, data-informed approach to move from problem identification to a validated solution.
1. Evaluate
I started with a heuristic evaluation to systematically identify usability problems based on established UX principles.
2. Redesign
I created targeted, high-impact design solutions and a high-fidelity prototype to address the identified issues.
3. Validate
I defined a robust testing plan to validate the redesign with real users, using both qualitative and quantitative methods.
Why a Heuristic Evaluation?
For this project, I chose to conduct a heuristic evaluation to systematically identify and address the dashboard's usability issues. This method was the ideal choice because it is both principled and practical.
It Provides an Established Framework
A heuristic evaluation is grounded in Jakob Nielsen's 10 Usability Heuristics, a set of widely accepted principles derived from decades of usability research. Using this established framework ensures that the analysis is objective and consistent, based on proven standards rather than personal opinion. This adds significant credibility to the findings.
It's Efficient and Actionable
This approach is a fast and effective way to uncover many of the most common usability problems plaguing an interface. It moves directly from problem identification to clear, targeted recommendations. This efficiency was perfect for a project focused on making high-impact improvements.
Heuristic Evaluation
Areas for Improvement
1. Information Overload Slows Down Users
Problem: Cards on the dashboard were cluttered with long, descriptive text. This created significant visual noise, forcing users to read instead of quickly scanning for the form they needed.
Heuristic Violation #8 (Aesthetic & Minimalist Design), #6 (Recognition Over Recall).
Solution: Implement progressive disclosure. Hide the descriptions by default and reveal them on-demand in a tooltip when a user hovers or taps a small info
ⓘicon. This prioritizes scannability and drastically cleans up the interface.

2. Irrelevant Options Create Distractions
Problem: The dashboard displayed cards that were permanently inaccessible to certain users (e.g., an "Administrative Use Only" card for a standard employee). Even with a label, this is irrelevant information that adds clutter.
Heuristic Violation: #1 (Visibility of System Status), #8 (Aesthetic & Minimalist Design).
Solution: Hide what's irrelevant. The system should be role-aware and only display the tools and forms that are actually available to that specific user. This creates a tailored, distraction-free experience.
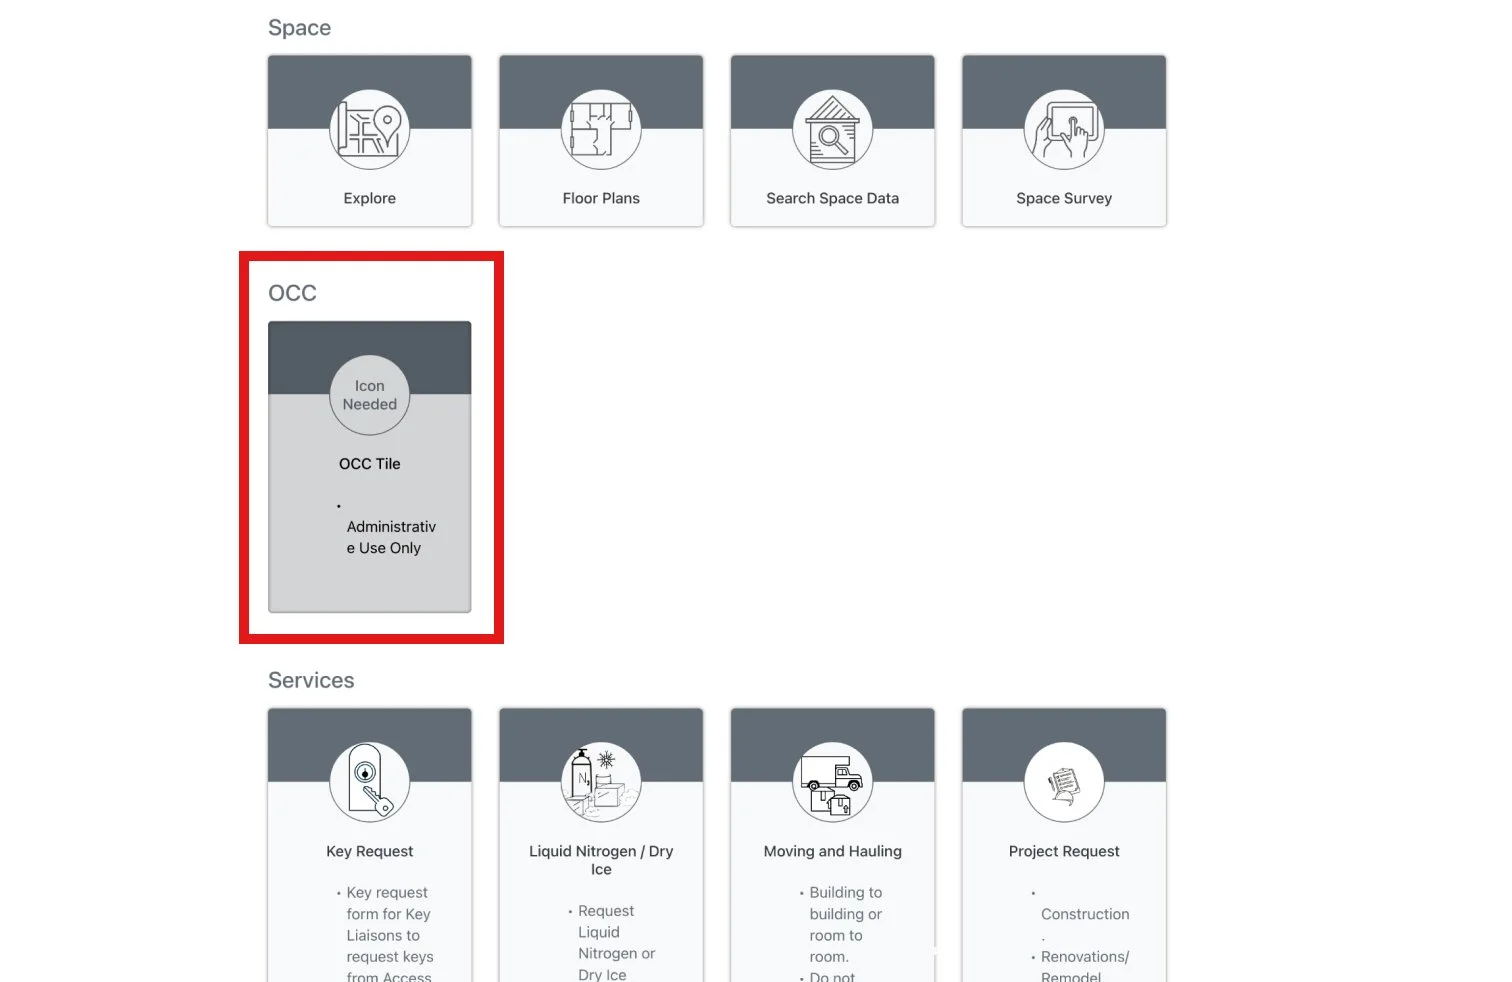
3. Ambiguous Language Causes Confusion
Problem: The dashboard contained a vague, non-action-oriented card labeled simply "Explore." Its valuable function—displaying a map and detailed information for all campus buildings—was completely hidden. I only discovered this by clicking the card and navigating through its options. This forces users to waste time on discovery rather than completing their task.
Heuristic Violation: #2 (Match Between System and Real World).
Solution: Replace ambiguous terms with specific, task-oriented language that makes functionality discoverable. The "Explore" card was renamed to "View Campus Map," which immediately and clearly communicates its purpose without requiring a click. This eliminates guesswork and makes the tool more efficient.

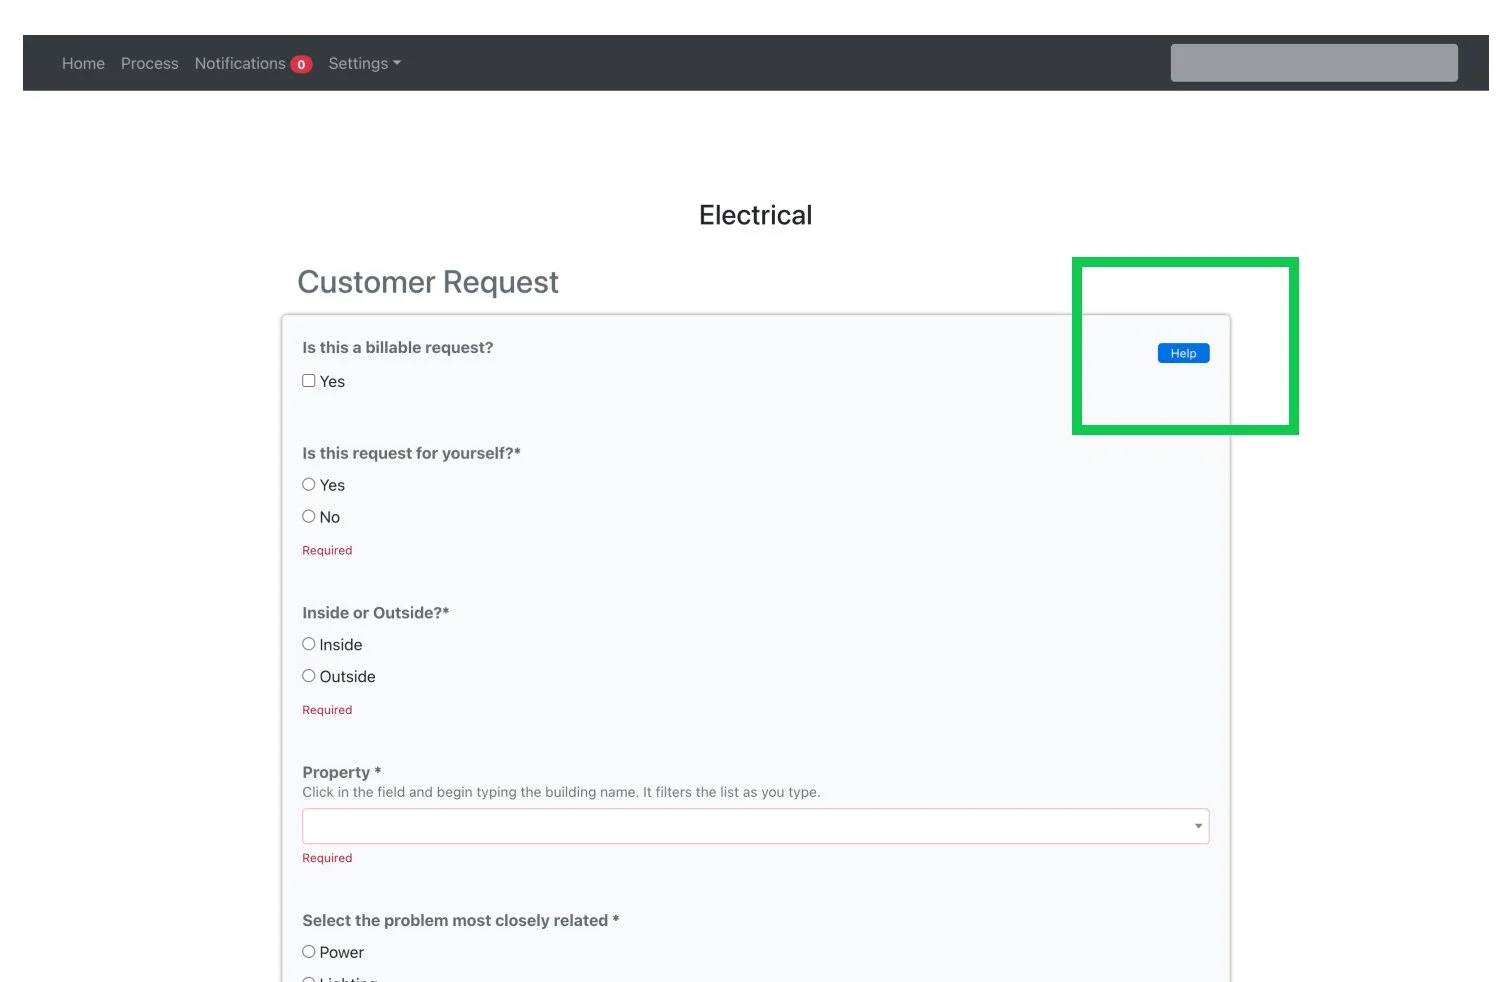
4. Inflexible Navigation Penalizes Users
Problem: Multi-page forms had "Next" and "Cancel" buttons but lacked a "Back" button. This forced users who made a mistake on a previous page to cancel the entire process and start over, losing all their work.
Heuristic Violation: #3 (User Control & Freedom).
Solution: Add a "Back" button on all multi-step forms. This provides navigational freedom, allowing users to easily review and edit their entries without the severe penalty of restarting the entire task.

Heuristic Evaluation
Key Strengths to Preserve
Effective Error Prevention (#5): The forms excel at preventing mistakes by using constrained inputs like dropdown menus for locations, which eliminates typos and ensures data accuracy.
Clear Error Recovery (#9): The system uses clear, inline validation. When a required field is missed, it's immediately highlighted with a specific error message, telling the user exactly what to fix.
Multi-Layered Help (#10): The design provides both contextual help next to potentially confusing questions and a global help email/number, ensuring users are supported at every stage.


Before & After
Dashboard Rework
Next Steps
Validation and Measurement
1. Understanding User Behavior (Qualitative Validation)
Objective: To uncover the "why" behind user actions and validate the intuitiveness of the new design.
Methodology: I will conduct one-on-one moderated usability tests with 5-7 employees, asking them to complete key tasks in a prototype while thinking aloud.
Key Data & Synthesis: I will collect direct quotes, observed behaviors, and pain points. This data will be synthesized using an affinity map to identify actionable themes (e.g., "Label clarity for 'Campus Map' is low") that will guide design refinements.
2. Measuring the Impact (Quantitative Validation)
Objective: To gather objective, measurable data that proves the redesign has a positive and significant impact on efficiency and user satisfaction.
Methodology: I will conduct a benchmark test, comparing the performance of a control group (old design) against a test group (new design) on the same critical tasks.
Key Success Metrics: This will measure our primary KPIs: Time on Task (targeting a 20% reduction), Error Rate (targeting a 30% reduction), and the System Usability Scale (SUS) score (targeting an A-grade score above 80).
3. Iteration and Launch: Acting on the Data
Objective: To make final, data-driven refinements to the design before a successful rollout.
Methodology: I will synthesize the insights from both qualitative and quantitative testing to inform a final round of high-impact design iterations.
Key Outcome: The process culminates in a phased rollout of the validated, high-performance dashboard, with ongoing monitoring to ensure a smooth transition for all employees.